Fig. 8.
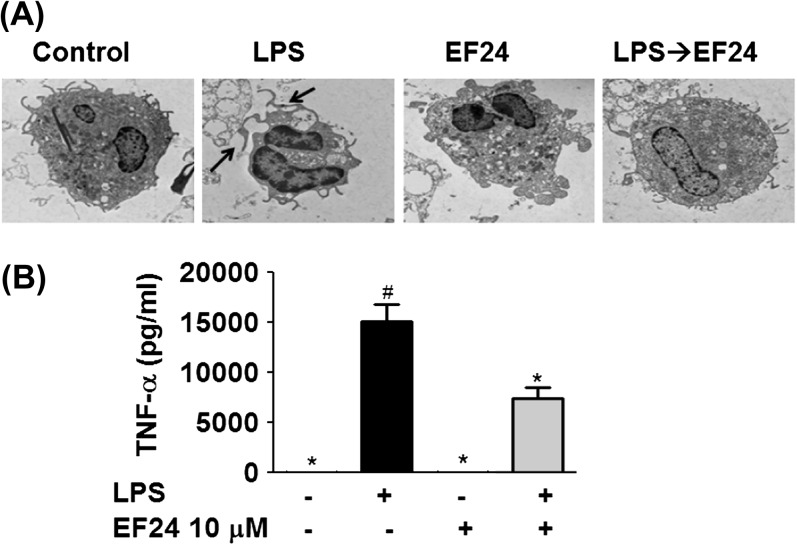
The effect of EF24 on primary bone marrow derived DCs. (A) Transmission electron photomicrographs (×3000) of primary bone marrow-derived DCs treated with control, 100 ng ml−1 LPS, 1 μM EF24 and 100 ng ml−1 LPS followed by 1 μM EF24 (LPS→EF24). The arrows indicate the presence of conspicuous dendrites on the primary DCs. The electron micrographs are representative of two independent experiments. (B) The cytokine levels of TNF-α (picograms per milligram, mean ± SEM) measured by ELISA secreted by primary DC. The results shown are a representative of three independent experiments each performed in triplicate. # P < 0.05 versus control cells and * P < 0.05 versus LPS-treated cells.

