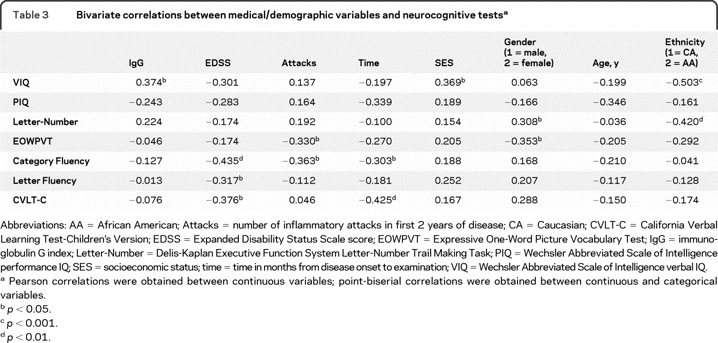
Table 3.
Bivariate correlations between medical/demographic variables and neurocognitive testsa

Abbreviations: AA = African American; Attacks = number of inflammatory attacks in first 2 years of disease; CA = Caucasian; CVLT-C = California Verbal Learning Test-Children's Version; EDSS = Expanded Disability Status Scale score; EOWPVT = Expressive One-Word Picture Vocabulary Test; IgG = immunoglobulin G index; Letter-Number = Delis-Kaplan Executive Function System Letter-Number Trail Making Task; PIQ = Wechsler Abbreviated Scale of Intelligence performance IQ; SES = socioeconomic status; time = time in months from disease onset to examination; VIQ = Wechsler Abbreviated Scale of Intelligence verbal IQ.
Pearson correlations were obtained between continuous variables; point-biserial correlations were obtained between continuous and categorical variables.
p< 0.05.
p< 0.001.
p< 0.01.
