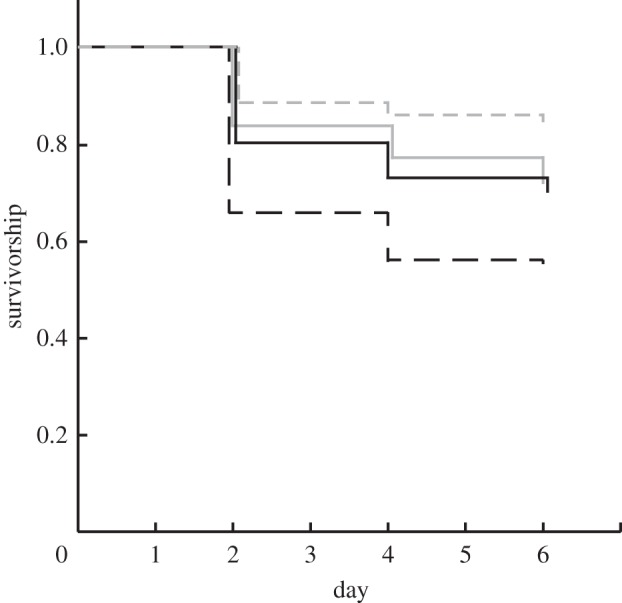
Figure 3.

Survivorship of S. caliendrum recruits during experiment II as calculated by Kaplan–Meier product-limit analysis for ambient pCO2, high pCO2, diurnal pCO2 and reverse-diurnal pCO2 treatments. The numbers of recruits at the start of the experiment in each treatment are shown in the legend. Grey solid line, ambient pCO2, n = 331; black solid line, high pCO2, n=138; grey dashed line, natural-phase diurnal pCO2, n = 354; black dashed line, reverse-phase diurnal pCO2, n = 402.
