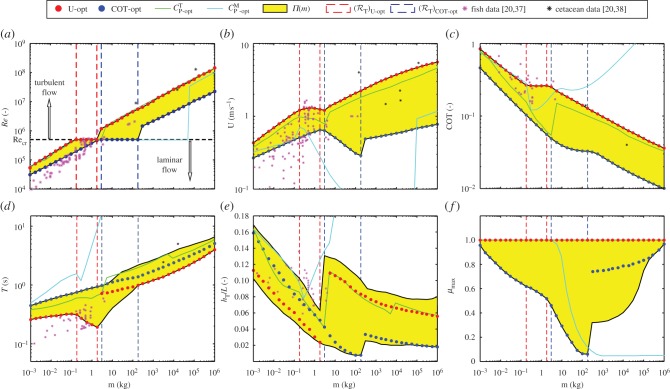
Figure 2.
Swimming characteristics of optimal populations Π(m) compared with empirical data for fishes [20,37] (magenta stars) and cetaceans [20,38] (black stars). Organisms with minimum COT are marked by blue circles and U-optimal organisms by red circles; the rest of Π(m) are represented by yellow region(s). The transition region (ℛT)U-opt is marked by red dashed lines and (ℛT)COT-opt by blue dashed lines. Alternative objective functions, power output-based power coefficient CPM (cyan lines) and total power-based power coefficient CPT (green lines), are also shown for comparison. Where mass measurements are missing, they are obtained from an m–L allometric expression (m = 12.62L3.11). (a) Reynolds number Re. (b) Sustained swimming speed U. (c) Cost of transport, COT. (d) Tail beat period T. (e) Relative tail amplitude hT/L. (f) Maximum active muscle portion μmax.

