
Figure 5.
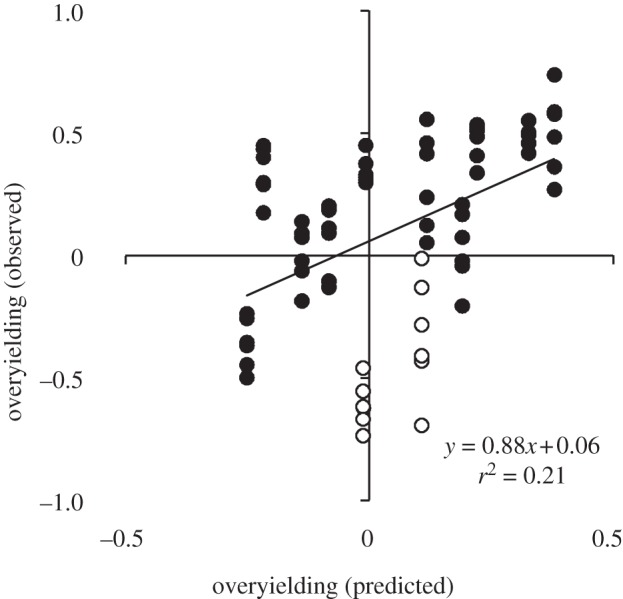
Observed species-level overyielding as a function of species-level overyielding predicted from a three-species PSF model. The model was parametrized with an independent dataset, as described in the text. Each point represents the mean value for each of three species grown in each of 24 community–soil type combinations, for a total of 72 values. Open and filled circles represent data nitrogen-fixing plants and non-nitrogen-fixing plants, respectively.