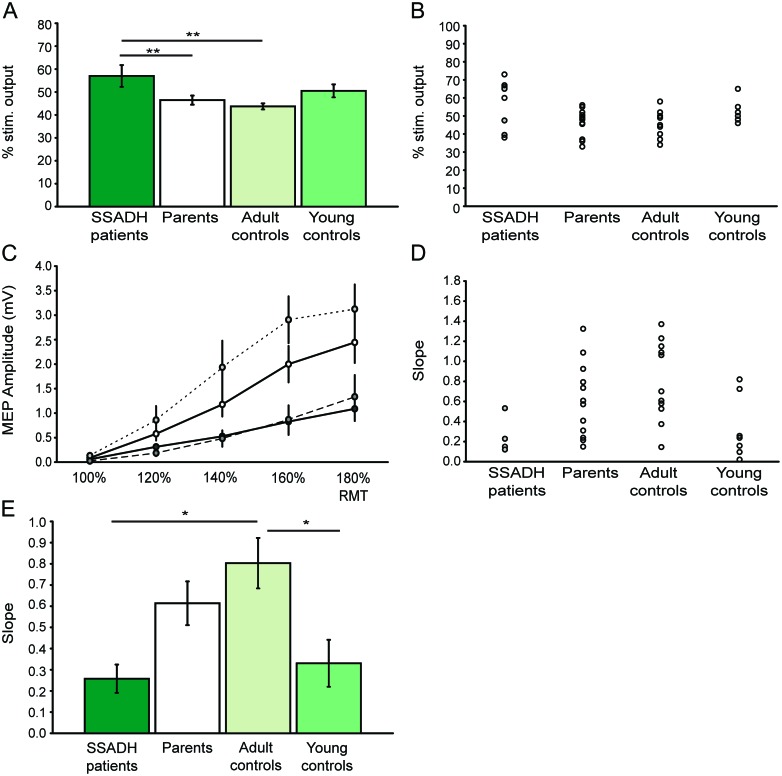
Figure 1. Age-dependent differences in M1 excitability.
(A) Young subjects show higher resting motor thresholds (RMT, in % of maximum stimulator output) compared to parents and adult controls. (B) Single subject data for motor thresholds. Filled circles (gray) indicate patients with medication. (C) Recruitment curves for the several groups show age-dependent differences between young subjects (including patients with succinic semialdehyde dehydrogenase [SSADH] deficiency) and adults. The color code is identical to that of A and E. (D) Single subject data for recruitment curve slopes. Normalization could only be performed in 4 patients. Filled circles (gray) indicate patients with medication. (E) The slope of the recruitment curve is significantly steeper in adults than in patients with SSADH deficiency or young controls. All group data are presented as mean ± SEM. Level of significance: *p < 0.05; **p < 0.01.

