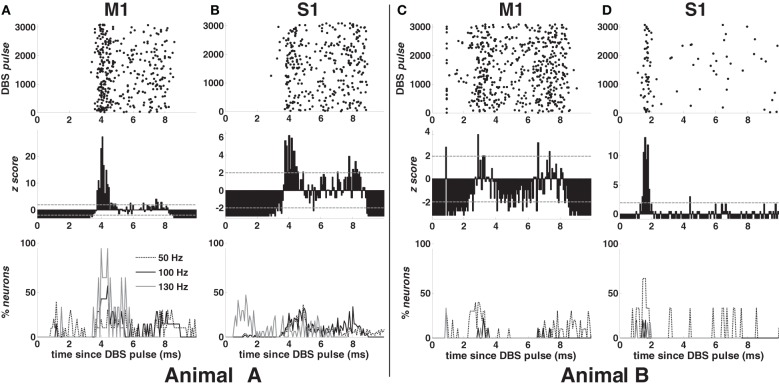
Figure 3.
Response to the DBS pulse in animal A (A,B) and B (C,D) in normal condition. First row (top): post-stimulus time raster of a neuron in M1 (A,C) and S1 (B,D) cortex during 100 Hz STN DBS. Second row: post-stimulus time histogram (PSTH) normalized to the pre-DBS neuronal activity for the neurons whose raster is depicted in the top row. Grey dashed lines indicate significance levels (±1.96). Third row (bottom): percentage of neurons with z-score >1.96 during the inter-stimulus time interval in M1 (A,C) and S1 (B,D) cortex for various DBS frequencies. Legend in (A) also applies to (B–D).

