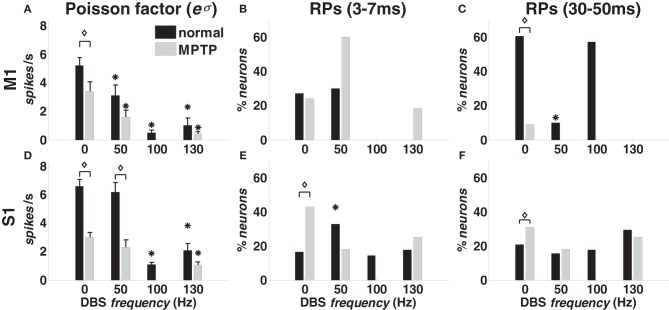
Figure 4.
Poisson factor and recurrent activation patterns (RPs) in M1 (A–C) and S1 (D–F) cortex in normal (black bars) and MPTP (grey bars) conditions (animal A), both at rest (0 Hz) and under DBS (50, 100, 130 Hz). (A,D) Population-mean value of the Poisson factor eσ (mean ± S.E.M.). (B,E) Percentage of neurons with RFPs (3–7 ms period). (C,F) Percentage of neurons with long-term patterns (30–50 ms period). Asterisks indicate significant differences under DBS vs. no DBS (in A,D: t-test, p < 0.05; in B,C,E,F: χ2-test, p < 0.05). Diamonds indicate significant difference in MPTP vs. normal conditions (in A,D: t-test, p < 0.05: in B,C,E,F: χ2-test, p < 0.05).

