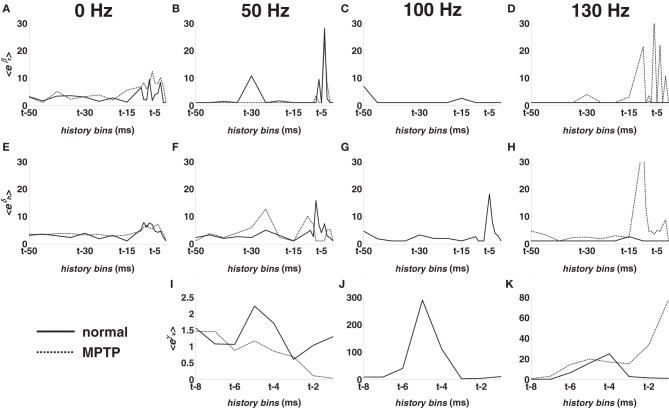
Figure 5.
Population-mean value of the point process model parameters for M1 cortex in normal (solid line) and MPTP (dashed line) conditions (animal A). (A–D) Mean value of eβr, r = 1, …, 18. (E–H) Mean value of eδh, h = 1, …, 18. (I–K) Mean value of eγν, ν = 1, …, 8. Parameters are depicted vs. the history bins for a generic time t. Parameters in the first column were estimated at rest (0 Hz). Parameters in the following columns were estimated under 50, 100, 130 Hz STN DBS, respectively.

