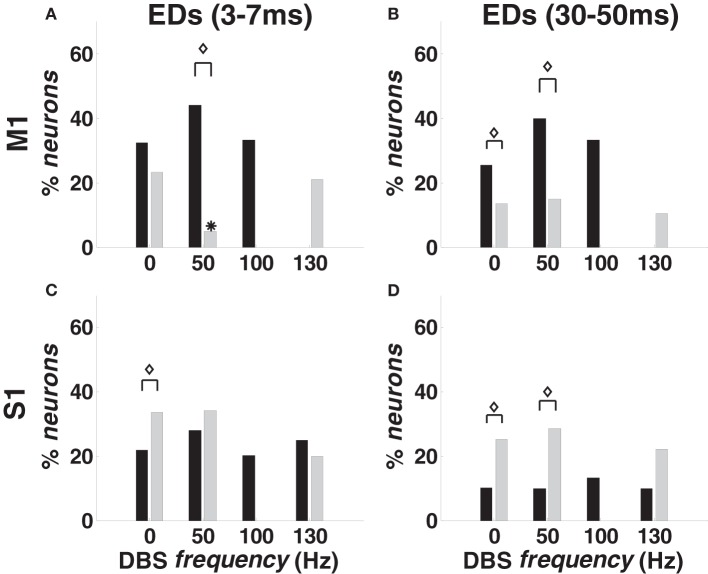
Figure 6.
Temporal ensemble dependencies (EDs) in M1 (A,B) and S1 (C,D) cortex in normal and MPTP conditions (animal A), both at rest (0 Hz) and during DBS (50, 100, 130 Hz). (A,C) Percentage of neurons with FEDs (3–7 ms period). (B,D) Percentage of neurons with long-term dependencies (30–50 ms period). Color code, asterisks and diamonds are as in Figure 4.

