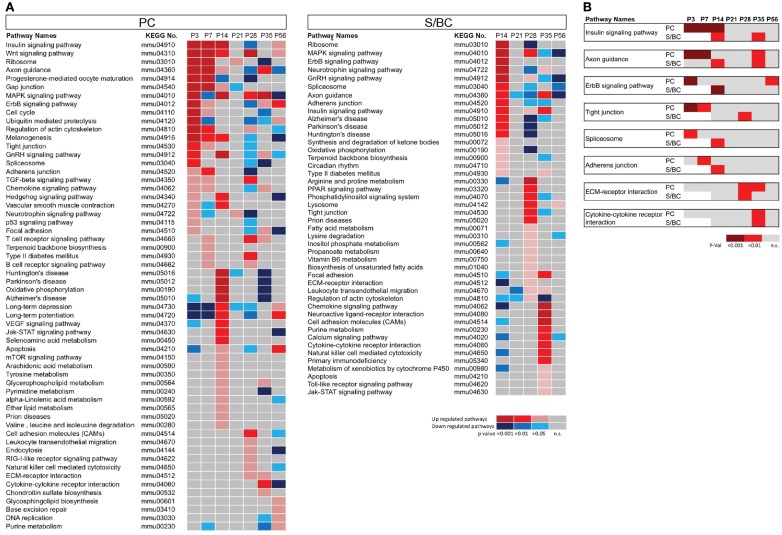
Figure 2.
Pathway enrichment analysis of developmentally co-regulated transcripts in PC and S/BCs. (A) Pathways enriched at specific developmental stages in PCs (left) and S/BCs (right). Each colored box represents significant p-values of the associated pathway across the developmental stages that are either upregulated (red), down-regulated (blue), or non-significant enrichment (gray). (B) Comparison between PC and S/BCs shows delayed elevation of pathways involved in early postnatal development in S/BCs.

