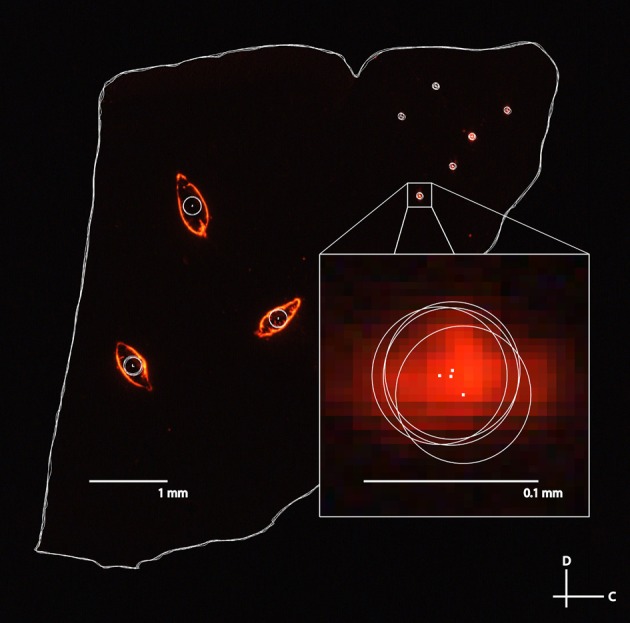
Figure 10.

A fluorescent image of a sagittal slice traced by four separate individuals for the second error analysis. The large white circles correspond to the three reference points and the small white circles correspond to the different electrode track placements (three bi-shank placements). Tracing error between individuals was determined by measuring the distance between the estimated electrode track point or reference point (i.e., the center of the circles indicated by white dots) between each pair of individuals, and averaging across all pairs of individuals and placements for five different slices. C, caudal; D, dorsal.
