
Figure 11.
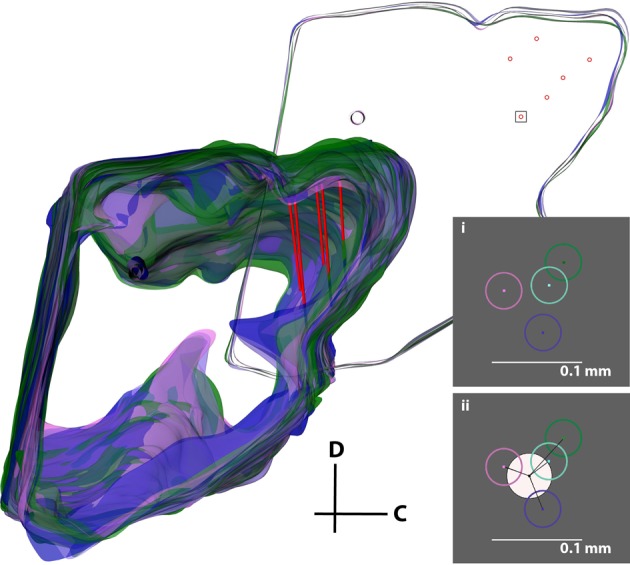
Error analysis procedure incorporating all errors in the reconstruction process. The same midbrain was reconstructed by four different individuals (purple, pink, cyan, and green), aligned, and normalized to each other. The consistent reference track for each midbrain and three pairs of electrode tracks from one of the four midbrains (red) are displayed. A single slice was removed for analysis (top right), and a box around one electrode placement is shown in inserts (i) and (ii). The error was either calculated (i) by taking the distance between each of the four electrode track points (center-to-center of the circles), or (ii) by finding the average of the four placements (white circle) and calculating the distance from its center to each electrode track point. The distances for each of the six electrode points across five slices were averaged to obtain the total error for this analysis. C, caudal; D, dorsal.