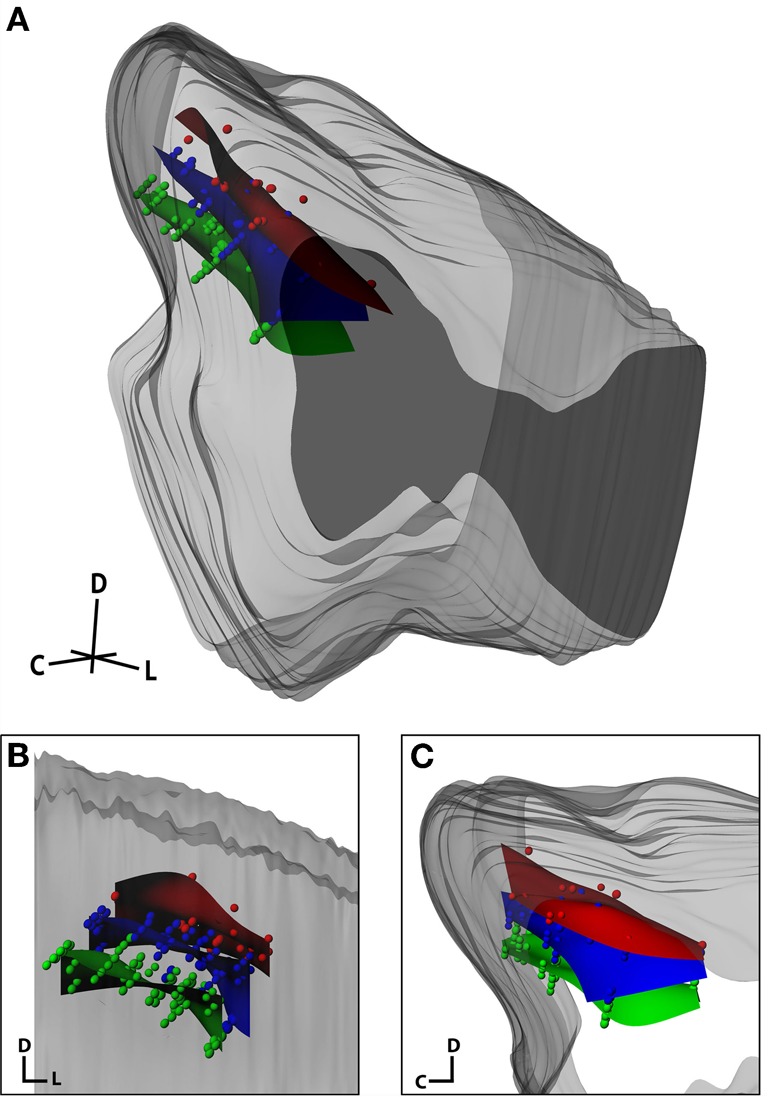
Figure 12.

Isofrequency laminae from three midbrains that were aligned and normalized together and shown within the standard midbrain in an isometric view (A), and magnified in a caudal (coronal; B) and lateral (sagittal; C) view. Dots correspond to individual electrode sites with best frequencies measured in vivo via frequency response maps. The curved planes were created in Rhinoceros as a best-fit to the electrode sites. The red, blue, and green planes correspond to low frequency (2–3.2 kHz; n = 26), middle frequency (5–8 kHz, n = 72), and high frequency (10–16 kHz, n = 80) sites, respectively. C, caudal; D, dorsal; L, lateral.
