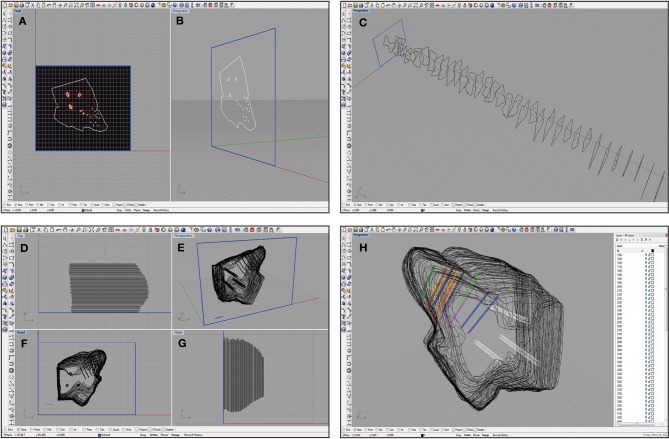
Figure 5.
Screen shots of the Rhinoceros software interface at various steps in the reconstruction process. A single slice was placed in a frame of arbitrary size (shown in blue) at the origin and traced as shown from a medial (A) and an oblique (B) view. This process was repeated for each slice that was also placed at the correct location on the medial-to-lateral axis (C). Damaged slices that could not be accurately traced were not included, leaving larger gaps between the surrounding slices. The slices were then aligned using the three reference points as shown from a top view (D), an oblique angle (E), a medial view (F), and from the caudal side (G). Larger spacing in (D) and (G) indicate where torn slices were removed from the reconstruction. These slices were also scaled using a 1 mm ruler (shown in blue; E and F). Finally, the wireframe was meshed using approximately 50 control points around the shell of the midbrain, and the reference points (white) and electrode array tracks (multiple colors; bi-shank probe pairs are color-matched) were meshed to create tube-like trajectories (H). The white menu on the right indicates the number of layers that can be turned on or off to increase visualization of specific features at any given time.

