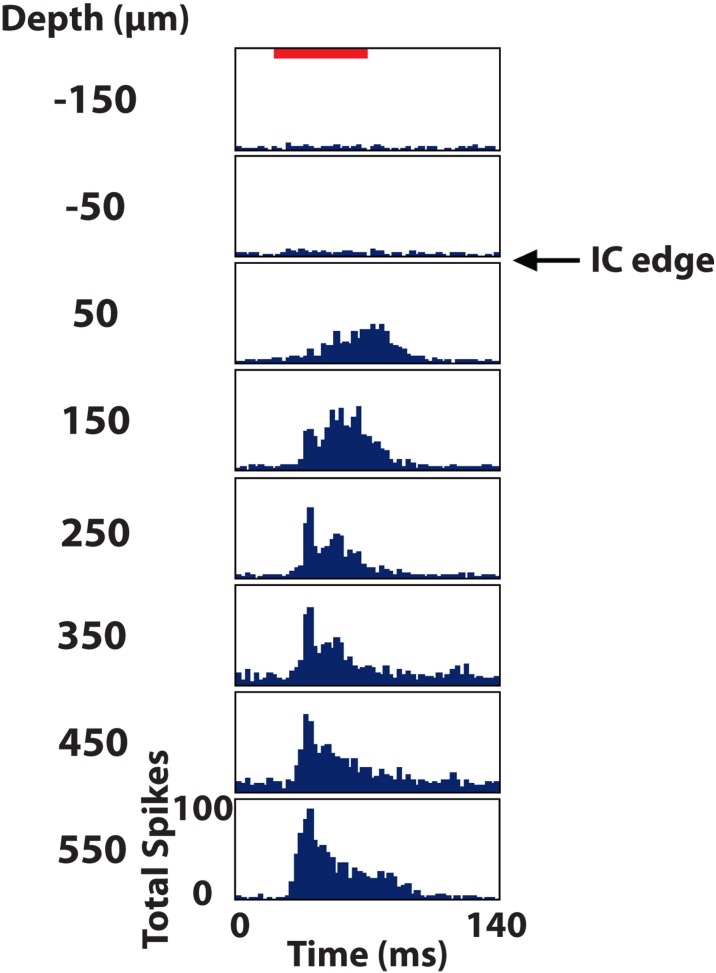
Figure 6.
Post stimulus time histograms of eight sites in the inferior colliculus (IC) in response to 100 trials of broadband noise (70 dB SPL, 6 octaves centered at 5 kHz). The red bar corresponds to the acoustic stimulus (60 ms duration) and depths are labeled relative to the superficial edge of the IC, which was approximated as the center point between the last electrode site responding significantly to the stimulus and the next site outside of the IC.

