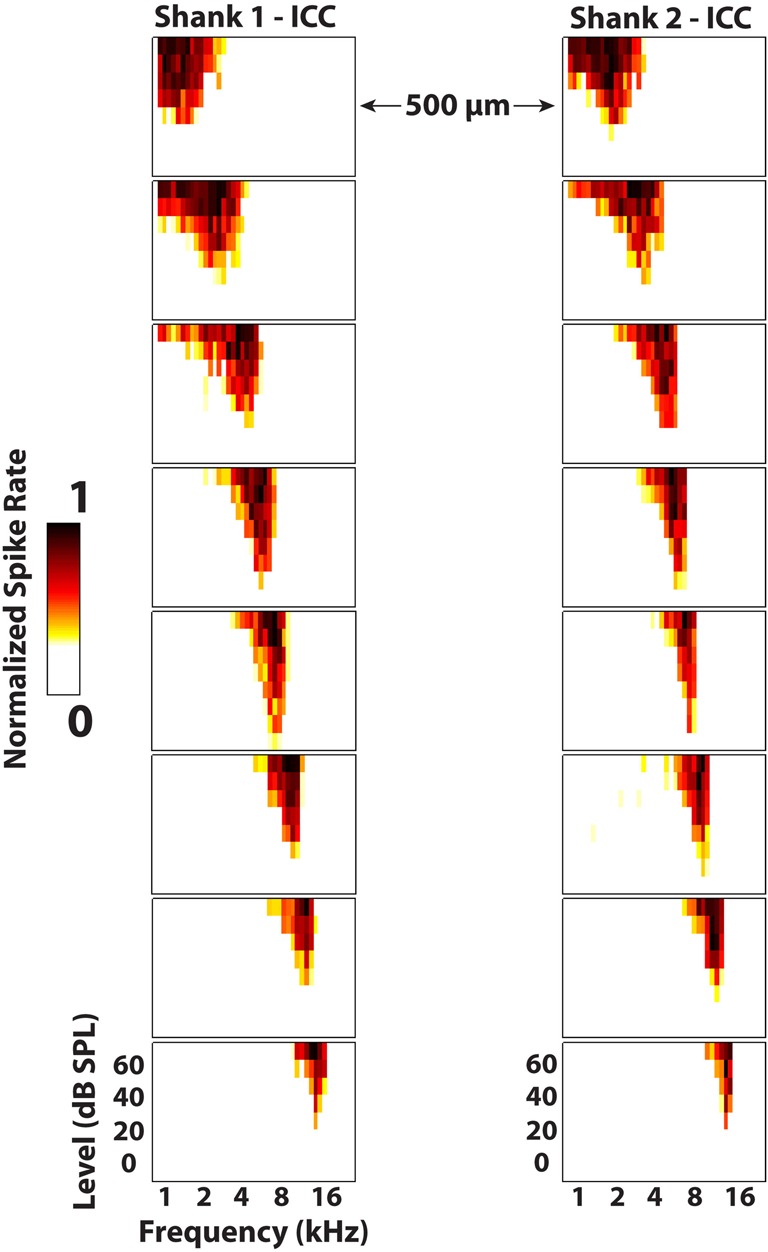
Figure 8.

Frequency response maps for two electrode shanks separated by 500 μm placed in the central nucleus of the inferior colliculus (ICC). ICC placements are characterized by sharp tuning and a consistent tonotopic shift from low (superficial sites) to high (deep sites) frequencies. Spike rates were normalized to the maximum number of spikes for each site across all stimuli. Every other site (200 μm spacing) along the electrode shank is plotted. The colorbar was adjusted to remove spontaneous activity to enhance visualization of the response maps.
