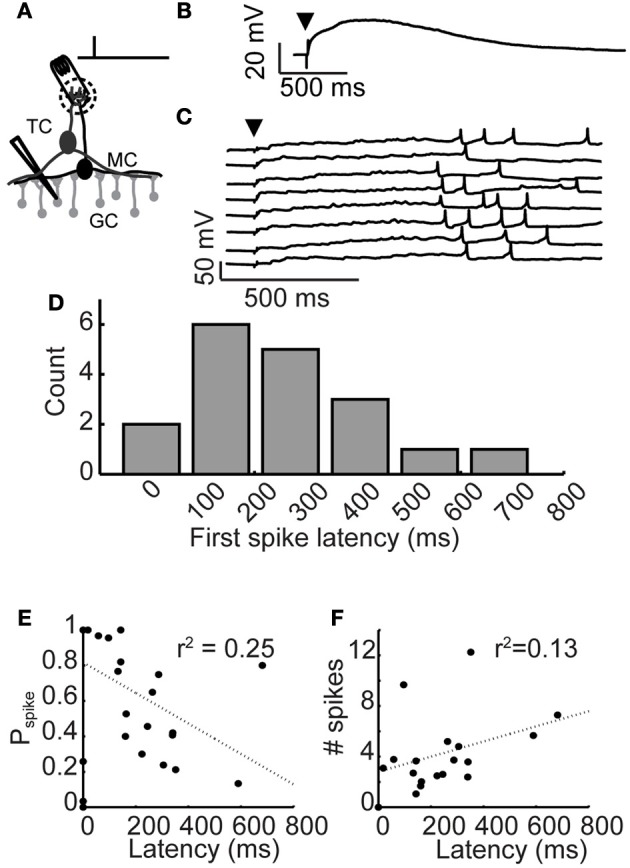
Figure 1.

Long-latency granule cell activity. (A) Experimental setup: A brief, 300 μs stimulation pulse was applied via an extracellular stimulating electrode impaled into a glomerulus. Responses of inhibitory granule cells were recorded using patch clamp. (B) Average depolarization following glomerular stimulation. Arrowhead denotes stimulation time. (C) Example voltage traces from a granule cell following glomerular stimulation (arrowhead), eight trials shown. (D) Distribution of mean first spike latencies across granule cell population. (E) Relationship between granule cell first spike latency and spike probability. (F) Relationship between granule cell first spike latency and evoked rate.
