
Figure 5.
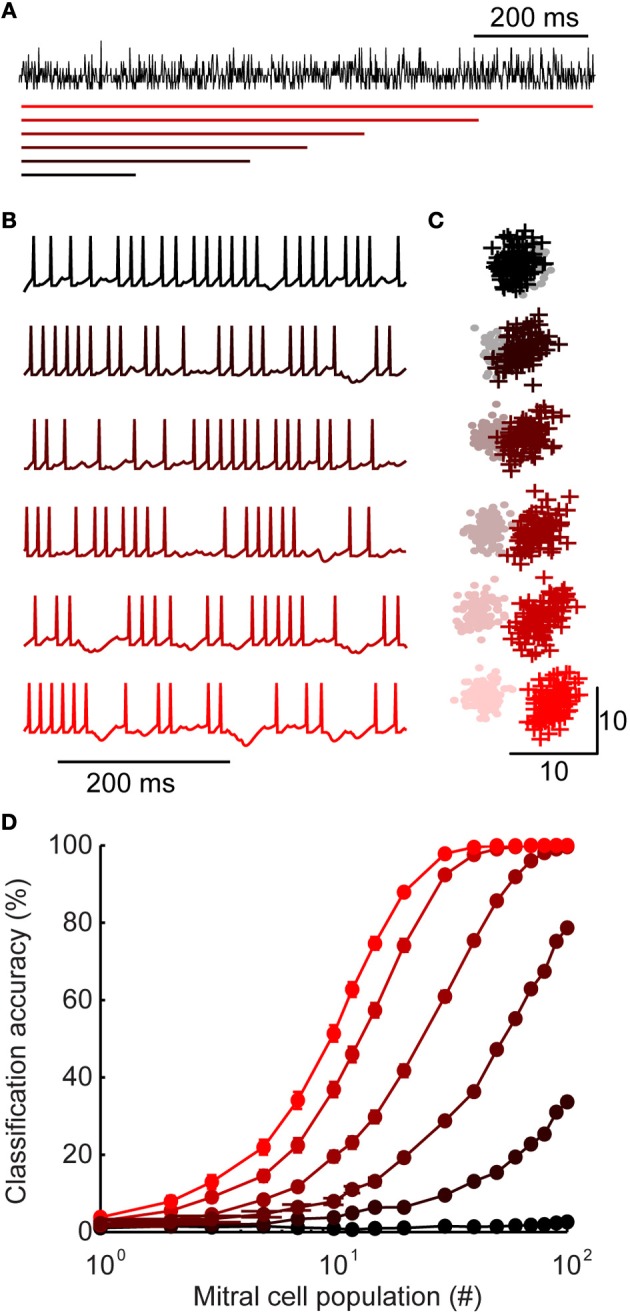
Inhibition with widely distributed latency improves stimulus discrimination. (A) Generating inhibition. For each stimulus, a population spiking template is generated (shown here in black). Model granule cell spike times are assigned such that the sum of all spikes is equal to the peri-stimulus time histogram template. While the total spiking is equal across model variants, they differ in the range of first spike latencies (shown with colored bars, below). First spike latencies ranged between 0 and (from bottom to top) 200, 400, 500, 600, 800, or 1000 ms. (B) Example of mitral cell spike trains receiving inhibition from each model variant shown in A. (C) First two principal components of mitral cell population firing for one pair of stimuli. Stimulus 1 = +; stimulus 2 = •. For each model variant, 100 trials are plotted per stimulus. (D) Classification accuracy of 100 stimuli as a function of population size. Colors correspond to model variants plotted in A–C. Bars denote s.e.m.