
Figure 8.
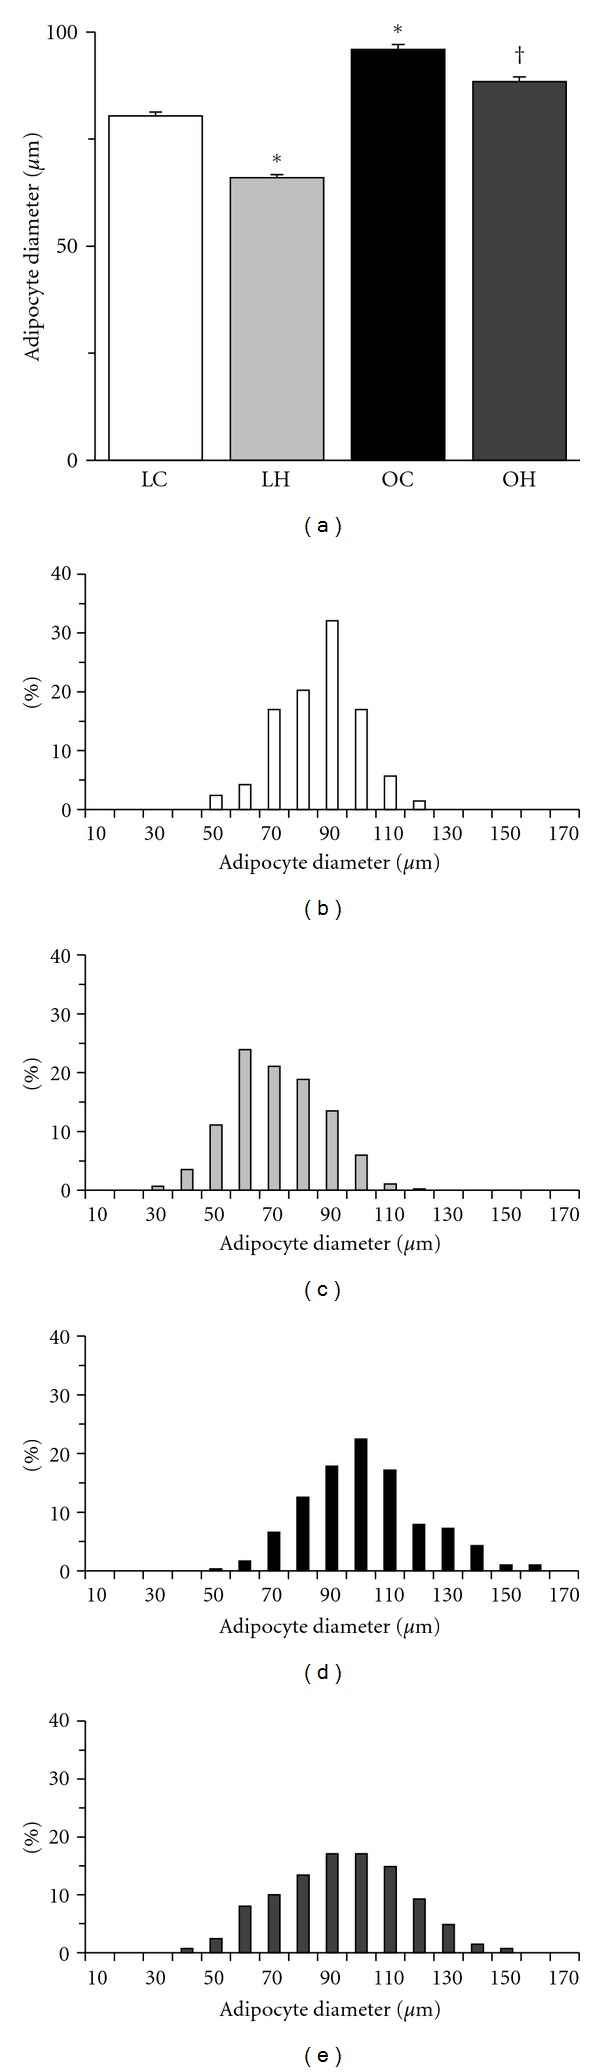
Diameter of adipocytes (a) and distribution of adipocyte size ((b) LC group; (c) LH group; (d) OC group; (e) OH group). The values of adipocyte diameter are presented as the mean ± SEM. * and † are significantly different from the LC and OC groups, respectively, at P < 0.05. In each adipose tissue, over 100 adipocytes were measured.