Fig.3.
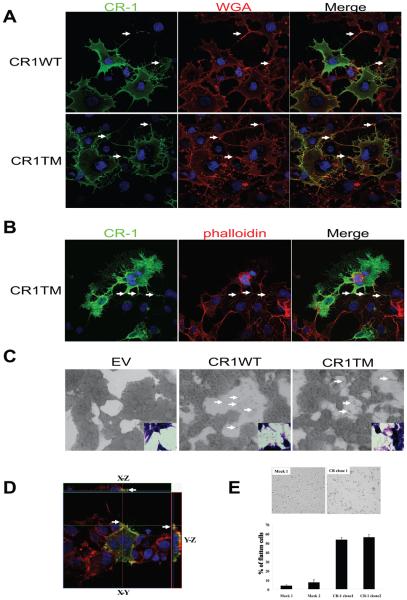
Effect of membrane-forms of CR-1 expression on cellular morphology. (A-B) CR-1 protein was visualized in COS7 cells transiently transfected with the indicated expression vectors. Plasma membrane was stained with wheat germ agglutinin (WGA) in non-permeabilized cells (A) and actin cytoskeleton was visualized with phalloidin in permeabilized cells (B). Arrows indicate sites of cell-to-cell contact by CR-1-induced membrane extensions. (C) Detection of cellular debris/processes on the surface of culture plates (arrows). 293T cells transfected with the indicated expression vectors were grown to subconfluency and photographed with a phase-contrast microscope (large panels) or with a regular light microscope after Hematoxylin-Eosin staining (insets). (D) CR-1 protein localization (green) in 293T cells was assessed three-dimensionally with confocal microscope. Actin cytoskeleton and nuclei were stained with phalloidin (red) and DAPI (blue), respectively. Arrows indicate the adhesion sites at the edge of the cell. (E) Cell adhesion assay of IEC6 clones. Representative images 45 min after seeding are shown in the upper panel. Percentage of flattened cells was manually quantified (lower panel). Values represent mean ± SD of three independent experiments.

