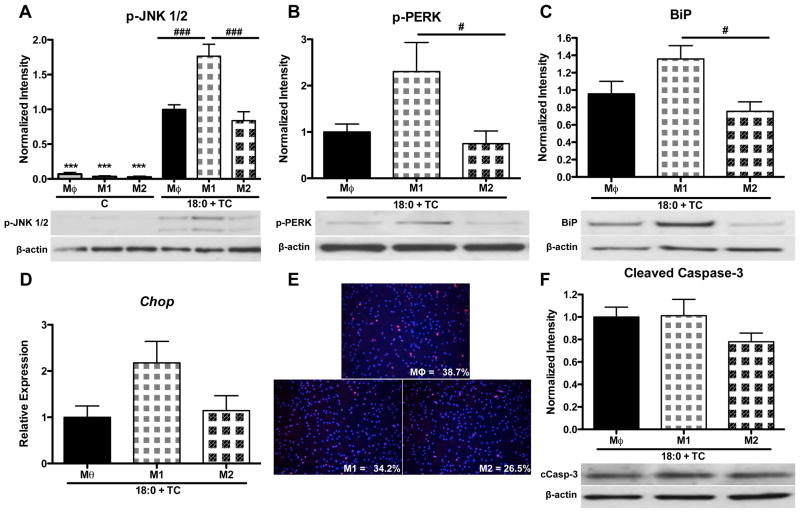
Figure 6. Polarization of MPMs to an M1 phenotype increases susceptibility to inflammation and ER stress in response to intracellular stearic acid accumulation.
MPMs were polarized for 24 h with vehicle, LPS (10 ng/ml), or IL-13 (4 ng/ml) to induce a Mθ, M1, or M2 phenotype, respectively. Cells were then co-treated with stearic acid (18:0, 90 μM) and TC (2.5 μM) for 16 h in the presence of polarization agents. Controls were treated for 40 h with polarizing agents in the absence of stearic acid and TC. A–C) Western blot analysis for: A) phospho-JNK 1/2, B) phospho-PERK, C) BiP. D) Gene expression analysis of Chop mRNA by real-time RT-PCR. E) Detection of apoptotic cells by TUNEL (red) and DAPI (blue) staining. Magnification: 20X. F) Western blot analysis of cleaved caspase-3. Data are presented as mean ± SD. n = 5–9/group. Abbreviations: C, control; TC, triacsin C; 18:0, stearic acid; Mθ, unpolarized macrophage; M1, LPS polarized macrophage; M2, IL-13 polarized macrophage. *** p<0.001 compared to Mθ of 18:0 + TC group, # p<0.05, ### p<0.001 compared to M1 of 18:0 + TC group.

