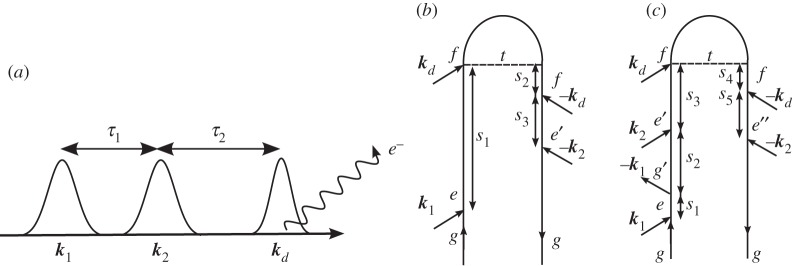
Figure 12.
(a) A pulse sequence for the MD photoelectron spectroscopy (MDPES) experiment. (b) A closed-time path-loop diagram for the dominant contributions to the MDPES signal when pulses k1 and k2 are electronically resonant and phase locked (Sii). (c) A closed-time path-loop diagram for the dominant contributions to the MDPES signal when pulses k1 and k2 are electronically off-resonant and resonant, respectively (Siii).

