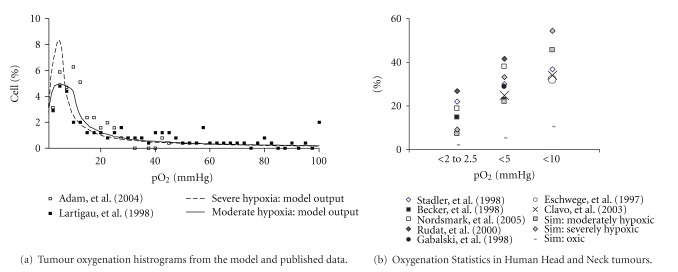
Figure 1.
The distribution of tumour oxygen levels used (a) to simulate moderate and severe tumour and (b) in simulations (sim) compared to published data for three oxygenation ranges [4, 30–35]. The distributions in (a) represent the pO2 histogram outputs from the model using a log-normal random number generator.

