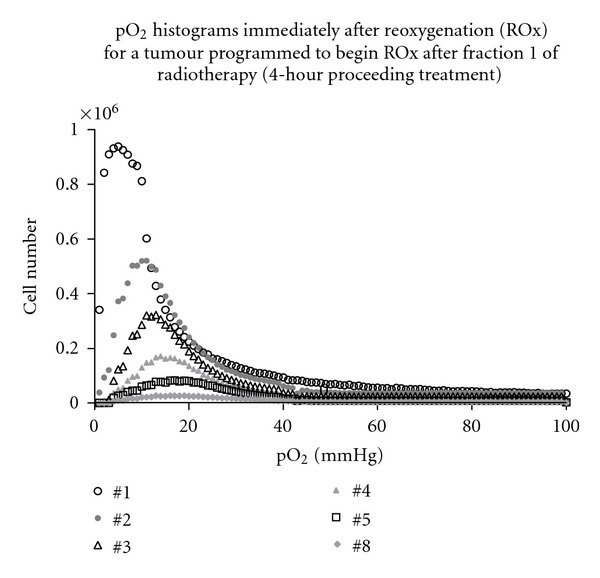
Figure 8.

Oxygenation (pO2) histograms after each fraction of simulated conventional radiotherapy, ranging from fractions 1 to 8 of a moderately hypoxic tumour. In this example, treatment is initiated when the tumour population has reached 108 cells and hypoxic quiescent cells are reoxygenated above 1 mmHg by fraction number 11 (5 × 10⁶ cells) and above 5 mmHg by fraction 20 (5 × 10⁵ cells).
