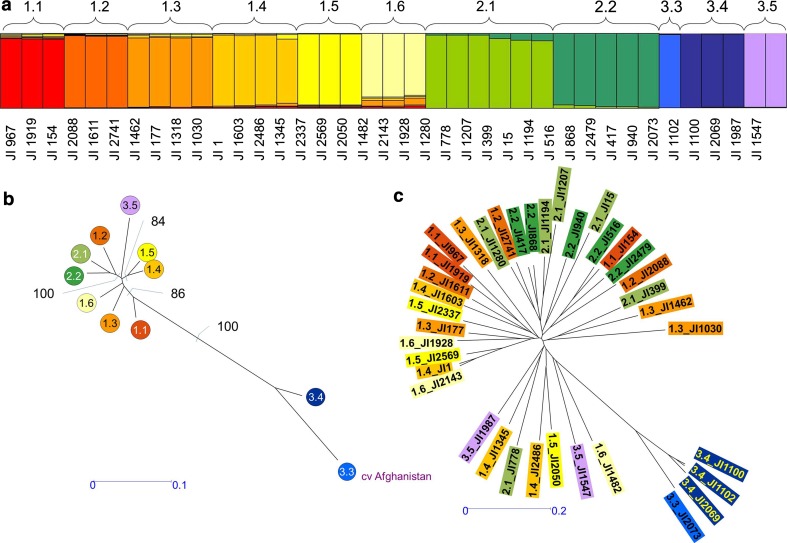
Fig. 1.
SSAP analysis of strongly assigned accessions. a Assignment of Q from Jing et al. (2010). b Neighbour joining (NJ) tree calculated using DARwin5 (Perrier et al. 2003). Allele frequency within the population sub-groups of Jing et al. (2010) was calculated in an Excel sheet and the majority consensus NJ tree with 100 bootstraps calculated. Bootstrap values higher than 80 % are indicated. c The corresponding NJ tree for individual accessions is shown

