
Figure 1.
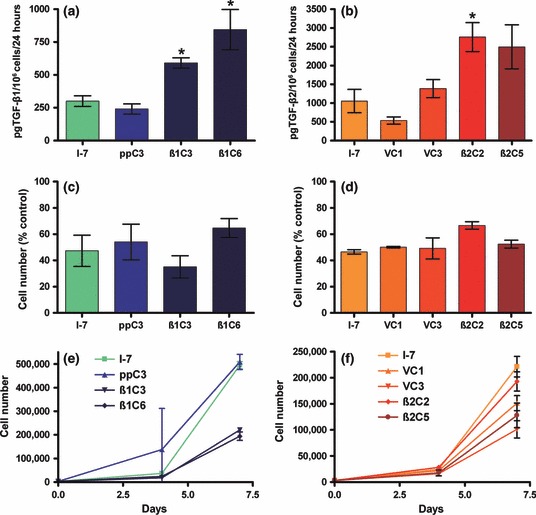
(a,b) production of TGF-β1 or TGF-β2, respectively, as determined by ELISA, total ligand production is expressed as pg produced in 24 h by 1 × 106 cells. (c,d) Growth inhibitory response to TGF-β1 of I-7β1 or I-7β2 clones, respectively. (e,f) Growth characteristics of a monolayer culture of parental, vector and I-7β1 clones or I-7β2 clones, respectively. Cells were counted at 4 and 7 days after seeding. Results are the means of values from conditioned media collected from at least three independent experiments (a,b) or representative of three independent experiments (c–f) ± SD. *Produced significantly (P < 0.05) more ligand than parent or vector controls.