
Figure 4.
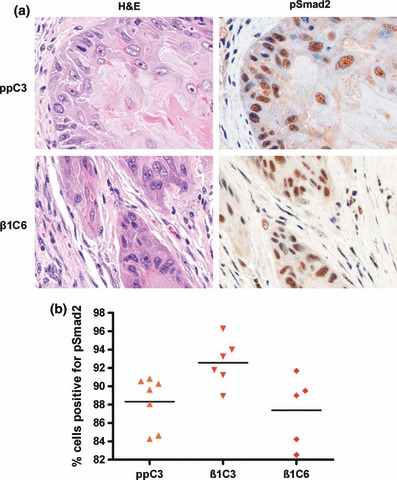
pSmad2 expression in tumours formed by vector and TGF-β1 overexpressing clones following transplantation to athymic mice. (a) Photomicrographs of representative areas of tumours formed by I-7ppC3 and I-7β1C6. Corresponding H&E stained sections are also shown. (b) Dot plot of the percentage of cells positive for pSmad2 in tumours formed by vector and TGF-β1 overexpressing clones. Ten random fields were counted for each tumour scored.