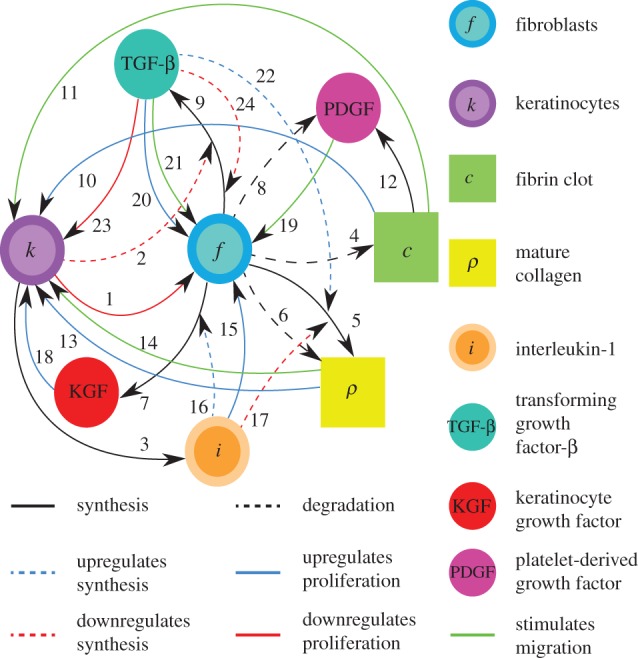
Figure 2.

Schematic of the interactions between the components of the model. The references for each arrow are listed in the electronic supplementary material, table S1. Black solid line, synthesis; black dashed line, degradation; blue dashed line, upregulates synthesis; blue solid line, upregulates proliferation; red dashed line, downregulates synthesis; red solid line, downregulates proliferation; green solid line, stimulates migration.
