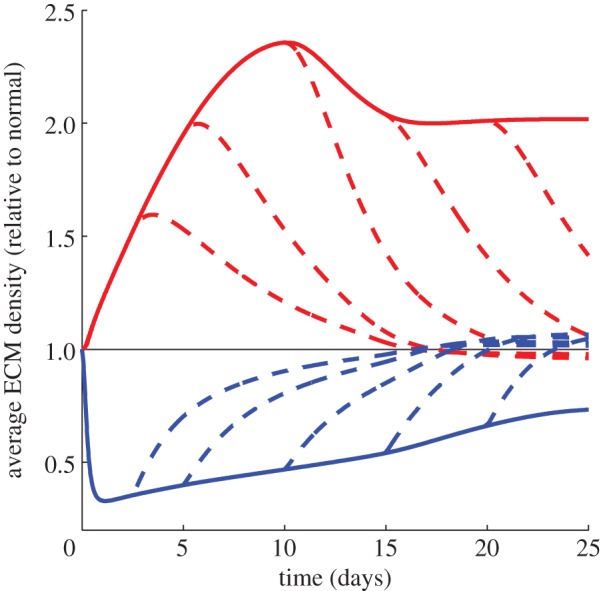
Figure 5.

Average density of ECM (relative to normal) for different pathologies up to t = 25 days. The normal case is represented by a thin black line, while the case of prolonged inflammation and chronic hypoxia are represented by thick red and blue lines respectively. The thick dashed lines represent the situations where a treatment is applied in each case at t = 2.5, 5, 10, 15 and 20 days. In the case of prolonged inflammation, we observe that the ECM levels in the wound tend to a much higher value than for the normal wound, corresponding to hypertrophic scarring. On the other hand, in the case of chronic hypoxia, we observe that the ECM levels are around 0.5 times the normal value, and this significantly inhibits the rate of healing (figure 6). When treatment is applied in each case, the ECM levels eventually approach a value close to that obtained in the normal healing process.
