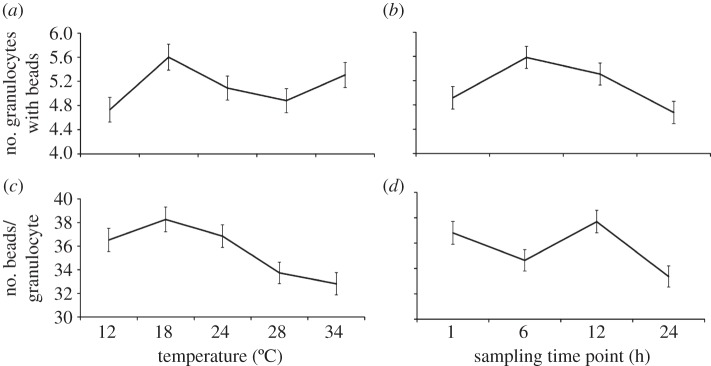
Figure 2.
Both temperature and sampling time point significantly influenced the phagocytosis of fluospheres. The effects of temperature on the mean (±s.e.m.) phagocytic index (number of haemocytes containing fluospheres out of 50 counted haemocytes) and capacity (the number of beads per haemocyte) are represented by (a) and (c), respectively (GLMs: index, Poisson distribution with log link function, Wald  , n = 191, p < 0.0001; capacity, normal distribution with identity link function, Wald
  , n = 195, p = 0.026). (b) and (d) depict the effects of sampling time point on the mean (±s.e.) phagocytic index and capacity, respectively (GLMs: index, Poisson distribution with log link function, Wald
  , n = 191, p = 0.001; capacity, normal distribution with identity link function, Wald
  , n = 195, p = 0.002).

