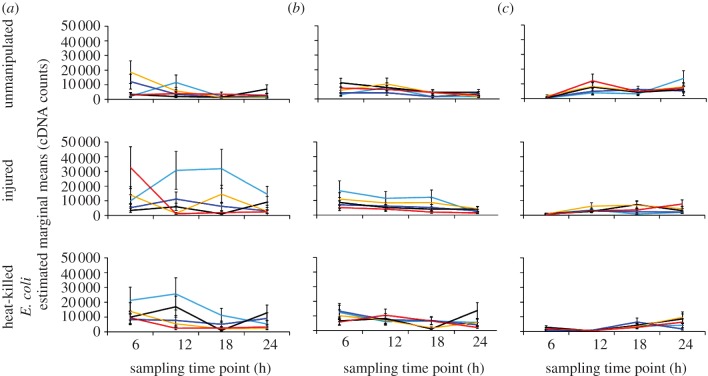
Figure 3.
The effects of temperature, sampling time point and immune challenge on the expression of immune genes. The relationship between mean gene expression (cDNA counts ± s.e.m.) for (a) defensin (DEF1) and (c) nitric oxide synthase (NOS) and temperature varied significantly among mosquitoes sampled at different time points post-challenge and treated with different immune stimuli (GLM, gamma distribution with log link function: DEF1 Wald  , n = 299, p < 0.0001; NOS Wald
  , n = 299, p = 0.003). The relationship between (b) cecropin (CEC1) expression and temperature varied significantly only among mosquitoes receiving different immune challenges (GLM, gamma distribution with log link function: Wald
  , n = 299, p = 0.004). Light blue lines, 18°C; dark blue, 22°C; black, 26°C; yellow, 30°C; red, 34°C.

