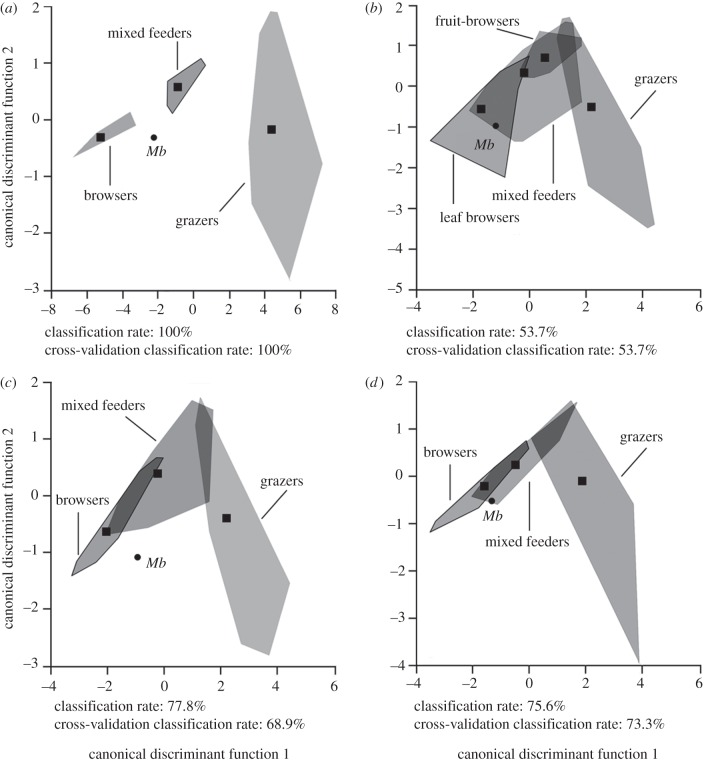
Figure 1.
Bivariate diagrams based on discriminant analyses. Grey areas indicating the morphospace defined by the dental mesowear signatures of extant ungulates, and squares representing centroids. Distribution of Myotragus balearicus (Mb) based on mesowear signatures with (a) a set of ‘typical’ species, and with (b) a larger dataset with ‘MABRA’ and without ‘MABRA’ using (c) conservative and (d) radical classifications. Outlined morphospaces indicate the dietary assignation obtained for M. balearicus in each analysis.

