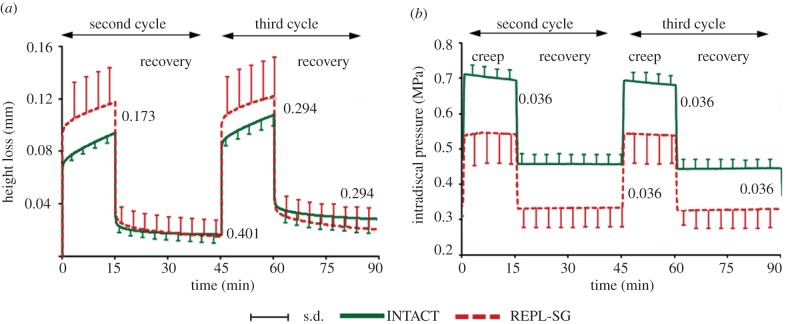
Figure 3.
Temporal changes of averaged (a) specimen height loss and (b) intradiscal pressure measured in the centre of the nucleus for INTACT and REPL-SG for the second and third loading cycles. Numbers in the diagrams represent the p-values estimated at the end of each loading and recovery phase (Wilcoxon signed-rank test). REPL-SG: nucleus tissue was removed and subsequently completely re-implanted.

