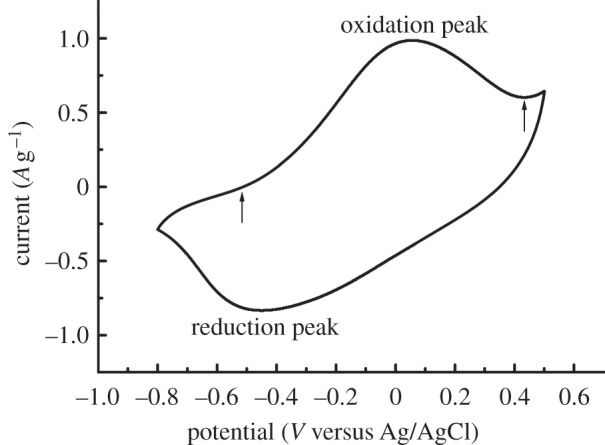
Figure 2.

A representative cyclic voltammogram of the 10th cycle of a heparinized sample in an isotonic oxalate solution (0.12 M, pH 7.3) showing oxidation and reduction peaks corresponding to the incorporation and expulsion, respectively, of oxalate ions by the PPy–cellulose material. The arrows indicate the positions of the first point of positive charge and the local minima following the oxidation peak, which were used as limits for calculations of ion exchange capacities.
