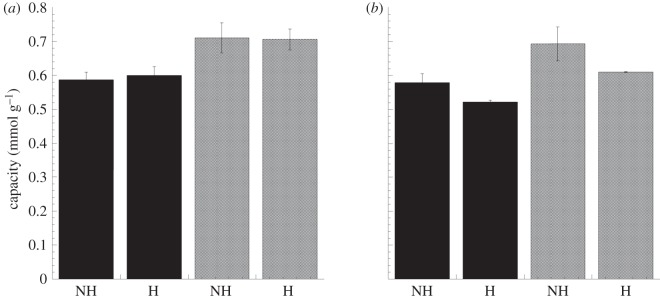
Figure 3.
Ion exchange capacities calculated from the voltammograms, taking into account the distribution of ions in the solution at the corresponding pH for non-heparinized (NH) and heparinized samples (H). Panels show capacities in (a) 0.10 M (black bars; pH 7.4) and isotonic (grey bars; 0.15 M, pH 4.4) phosphate solutions and (b) 0.10 M (black bars; pH 7.4) and isotonic (grey bars; 0.12 M, pH 7.3) oxalate solutions. No significant differences in capacity were observed between non-heparinized and heparinized samples. The values are expressed as the mean ± s.e. of the mean, n = 3.

