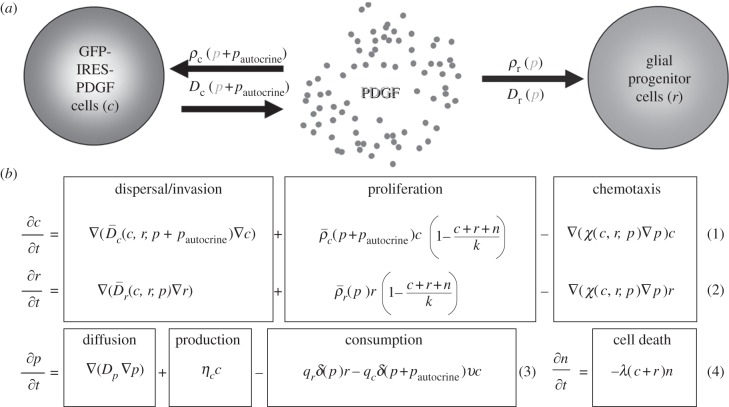
Figure 1.
PIR model. (a) Model schematic. The flow chart shows the main components of our model: c represents the population of glial progenitor cells that are infected with the PDGF-expressing retrovirus, r represents the glial progenitors that are recruited and do not have the retroviral infection, and p represents the free PDGF in the extracellular space (ECS). An injection of the retrovirus initiates the c population [4,21]. These cells secrete p at rate ηc into the ECS, and p is, in turn, taken up and consumed by the c and r populations at rates qc and qr, respectively. Uptake of p by c and r results in increased net cellular proliferation (ρc and ρr) and dispersal (Dc and Dr) in a dose-dependent manner. In addition to the paracrine stimulation from p, the infected cells experience autocrine PDGF stimulation in concentration pautocrine. (b) Model equations. The equations for the infected (c) and uninfected ‘recruitable’ (r) progenitor cells account for the movement and growth of the respective cell populations. Their net rates of migration and proliferation, D and ρ, respectively, depend on the local concentration of PDGF (p) and the population density, at a given time point, of their own cell type, c or r (equation 1 and 2). Logistic scaling of the net proliferation terms in these equations reflects the limits contact inhibition imposes on cell division when the total population approaches the maximum possible density in the tissue. Equation 3 accounts for the secretion of PDGF (p) into the extracellular environment at rate ηc, and loss of p owing to consumption by the c and r progenitor cells at rates qc and qr, respectively, which are scaled by the percentage of PDGF receptors that are activated (δ), and, for infected progenitors only, the percentage of receptors that are not already in use for autocrine signalling, but rather are available for binding-free PDGF, ν. The final equation for the remaining ‘normal’ brain cells (n) (which includes, but is not restricted to, neurons and other white matter cells) reflects their proportionate decrease in local density (via cell death, which may consist of either apoptosis or necrosis) as those of c and r increase and fill up/compete for the available space (equation 4). Note that we do not model the dead cells. (Further details of model development, including values of parameters and initial conditions, may be found in the electronic supplementary material.)

