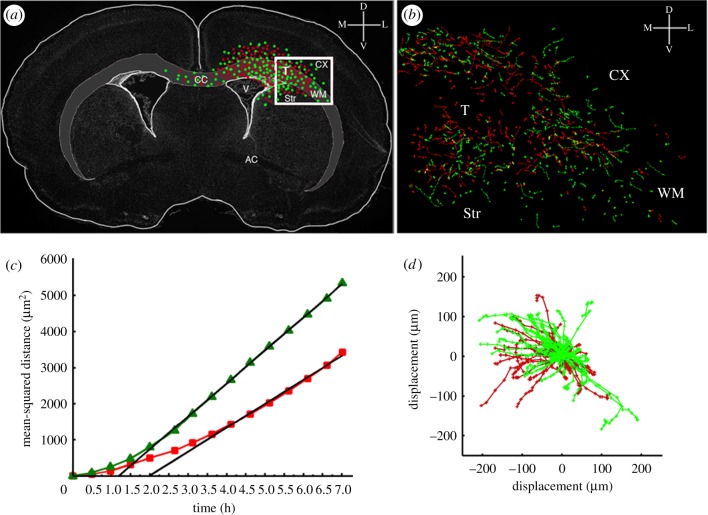
Figure 2.
Tracking the migration of PDGF expressing and recruited progenitors by time-lapse microscopy. Three hundred microlitre thick slice cultures were generated at 10 days post-co-injection with PDGF-expressing retrovirus and control retrovirus and two colour time-lapse microscopy was performed for 7 h to monitor the migration of PDGF-expressing progenitors and recruited progenitors. The migratory paths of individual cells were tracked using METAMORPH image analysis system. (a) A schematic of the coronal brain slice showing the tumour location and the distribution of PDGF-expressing progenitor cells (green dots) and recruited progenitor cells (red dots). The box represents the region of the slice that was filmed by time-lapse microscopy (T, tumour; CX, cortex; WM, white matter; CC, corpus callosum; Str, striatum). (b) The green and red lines represent the migratory paths of PDGF-expressing progenitor cells (green lines) and recruited progenitors (red lines). (c) Mean-squared distance travelled by the PDGF-expressing progenitors (green lines) and recruited progenitors (red lines). (d) Windrose plot showing the tracks of cells from (b) plotted with a common origin.

