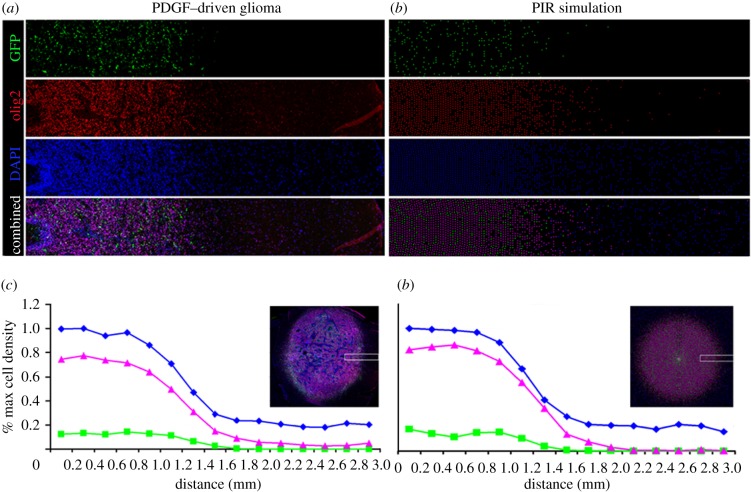
Figure 6.
Fluorescent micrograph compared with PIR simulation. The colour separated micrographs on the left side show the distribution and abundance of PDGF-expressing progenitor cells (green), olig2+ glial progenitors (red) and the total DAPI+ nuclei (blue) within a 3 × 0.5 mm strip at the infiltrative edge of PDGF-driven glioma. The corresponding images on the right side show the distribution and abundance of cells in a corresponding region of a simulated tumour generated by the PIR model (again, PDGF-expressing progenitors are green, all progenitors red, and all cell nuclei, blue). The graphs on the bottom show the actual (c) and simulated (d) percent measurements of each cell population within the 3 mm strip at the tumour's edge. The insets show the entire PDGF-driven tumour (a) and simulation (b) indicating the region of the tumour and simulation from which the strips were taken (white boxes).

