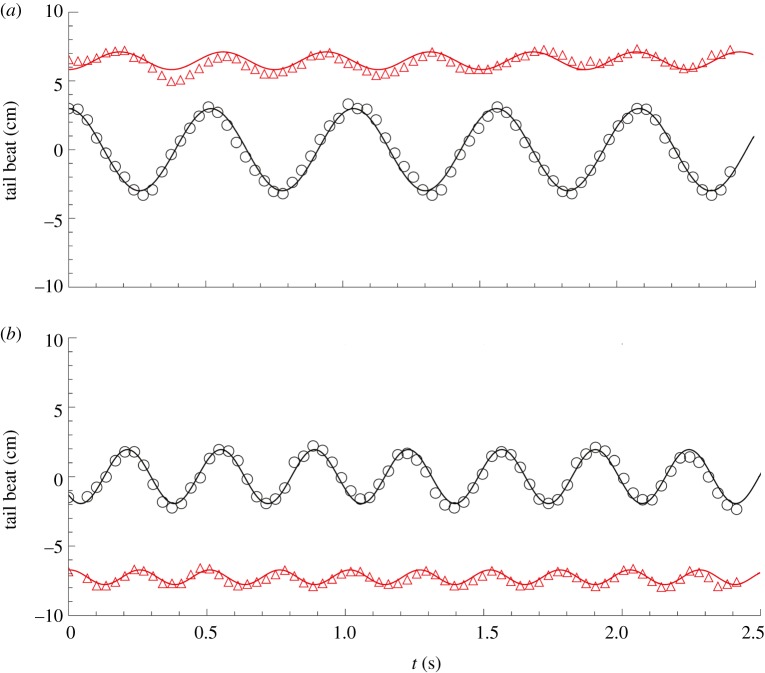
Figure 10.
Examples of traces of the tail movement of the robotic fish (black empty circles) and the fish (red empty triangles) when swimming together in the water tunnel at (a) 14 cm s−1 with TBFrobot = 2 Hz (V1F2) and at (b) 16 cm s−1 with TBFrobot = 3 Hz (V2F3). Solid lines represent sinusoidal fits of the tails' movements. (Online version in colour.)

