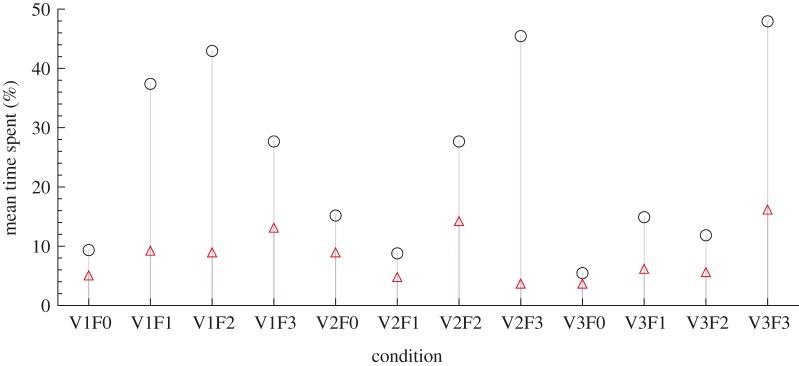
Figure 5.
Mean time spent within 4 BL to the robotic fish at the 12 different conditions (n = 6 at each condition) scaled with respect to the total acquisition time. Black empty circles represent the mean time spent when swimming in R ( ) at each of the 12 conditions. Red empty triangles represent the mean time spent in Rft (
 ) for each of the 12 conditions. (Online version in colour.)

