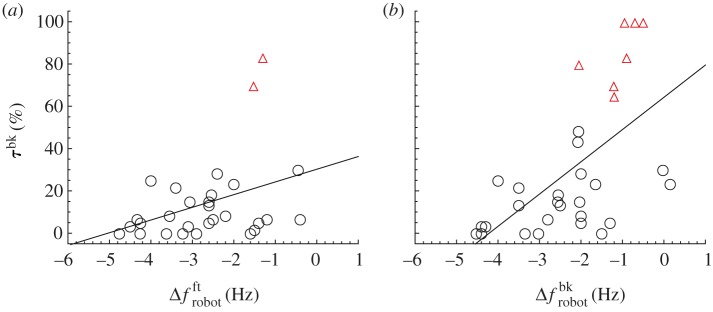
Figure 9.
Relationship between Δfrobot measured in both (a) front and (b) back position and τbk scaled with respect to the total acquisition time (linear regression, front position, y = 30.2 + 6x, r2 = 0.13, p < 0.05, n = 29; back position, y = 64.2 + 15.3x, r2 = 0.36, p < 0.01, n = 32). Red empty triangles identify individuals that hold station behind the robot. (Online version in colour.)

