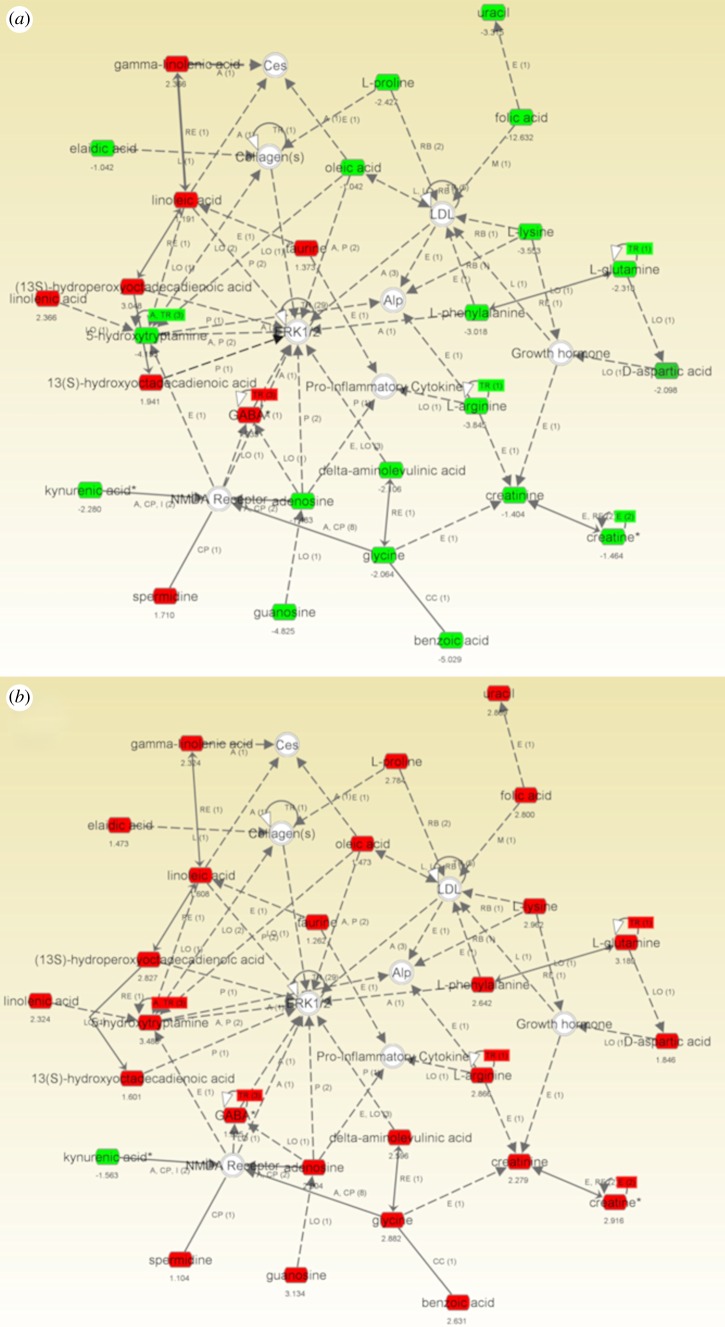
Figure 3.
Highest scoring IPA network showing the upregulated (red) and downregulated (green) metabolites in MSCs cultured for 3 days on (a) TCP versus planar Ti or (b) 15 nm Ti pillar-like features versus planar Ti. Note that most of the metabolites in the network that were upregulated on 15 nm were downregulated on TCP, and the prominence of the invited nodes ERK 1/2 and collagen in the network.

