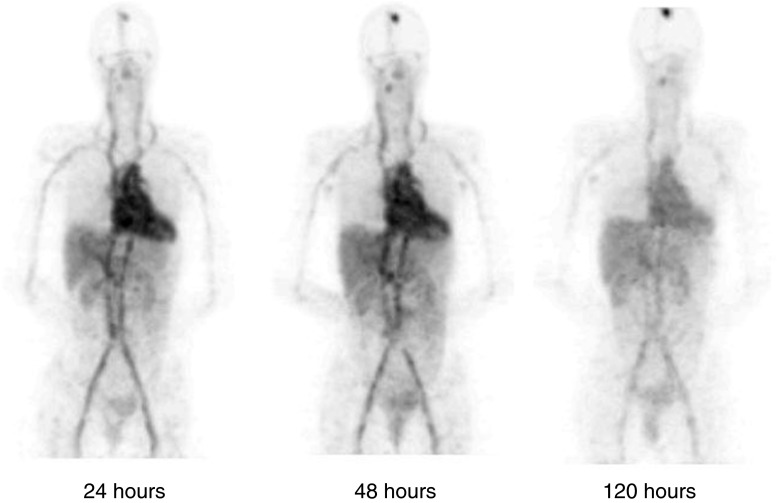
Fig. 5.
Time series of representative Zr-89 trastuzumab images (frontal view) in a patient receiving trastuzumab therapy as described in Dijkers et al. (71). Note the heart and great vessels with blood pool diminishing slowly over 5 days. Note the absence of antibody in the brain cavity, except for blood pool and a previously undetected metastatic brain lesion that is visible at the top of the skull and shows progressive uptake over the 5 days. The injected dose was 10 mg of Zr89-trastuzumab, 38 MBq (1 mCi) of Zr-89 illustrating the sensitivity of the imaging

