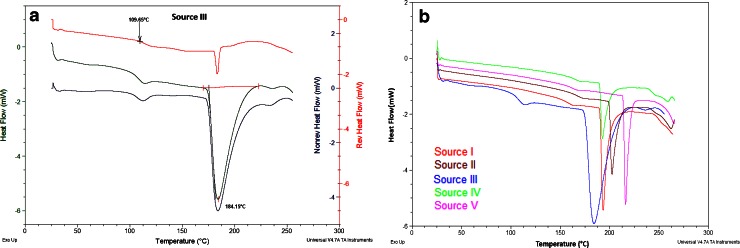
Fig. 2.
a Deconvoluted heat flow signals for MDSC of protamine sulfate from source III showing the reversing heat signal (top, red), total heat flow (middle, green), and non-reversing heat signal and b total heat flow thermograms for all five protamine sulfate samples showing the differences in their glass transition (T g) and melting (T m) endotherms

