
Figure 5.
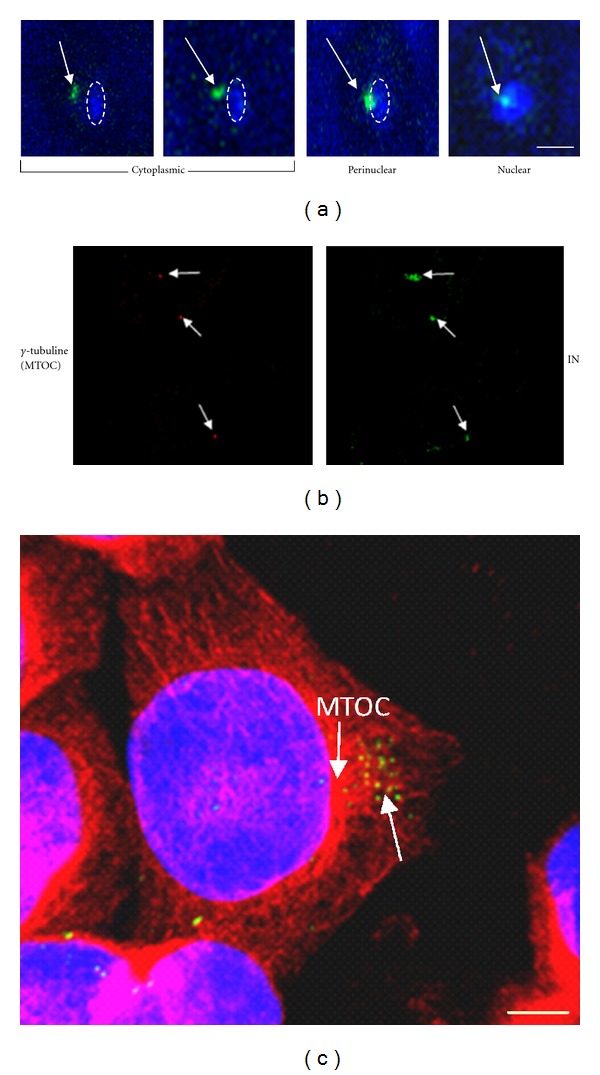
IN expressed in yeast and in human cell. (a) Expression of IN in yeast several times after induction. Cytoplasmic localisation: 6-7 h; perinuclear localisation: 8–10 h; nuclear localisation: 30 h. IN-GFP in green, nucleus in blue surrounded by dashed lanes. Barr = 1 μm. (b) Expression of IN in H9 cells 20 h after transfection. Left, MTOC in red after immunodetection of γ-tubulin (arrows). Right, IN in green immunodetected with anti-IN antibody (arrows). (c) Expression of IN in H9 cells at higher magnitude. IN in green, α-tubulin in red. Barr = 8 μm (Desfarges, unpublished results).