
Figure 2.
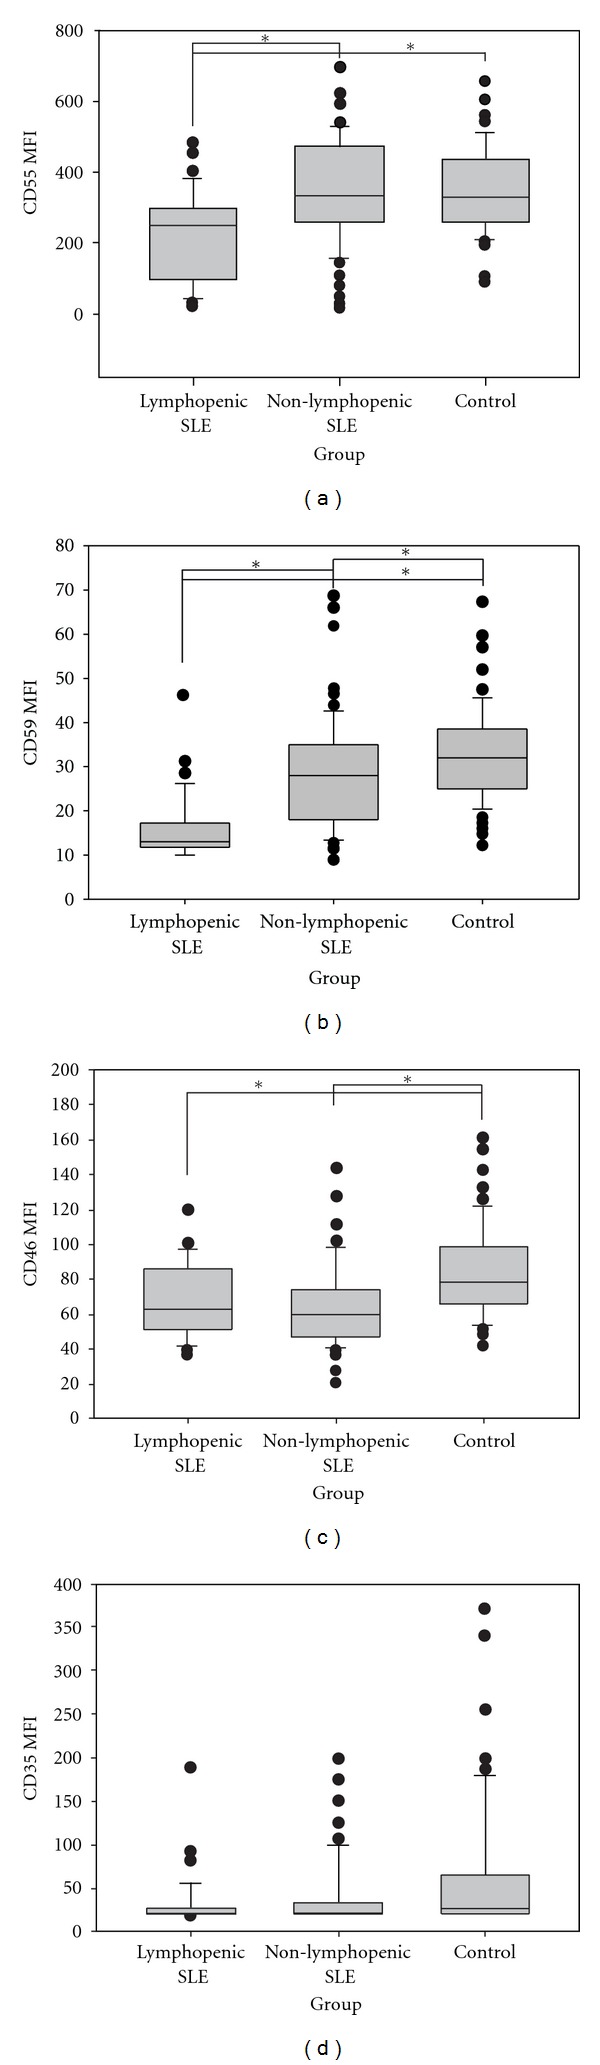
Creg surface expression of lymphocytes cell. The figure displays mean fluorescence intensity (MFI) of CD55, CD59, CD46, and CD35 on gated neutrophil from SLE patients with lymphopenia, without lymphopenia, and controls. Median and interquartile range from all subjects studied in each group were shown. *Significant statistical difference (P < 0.05).