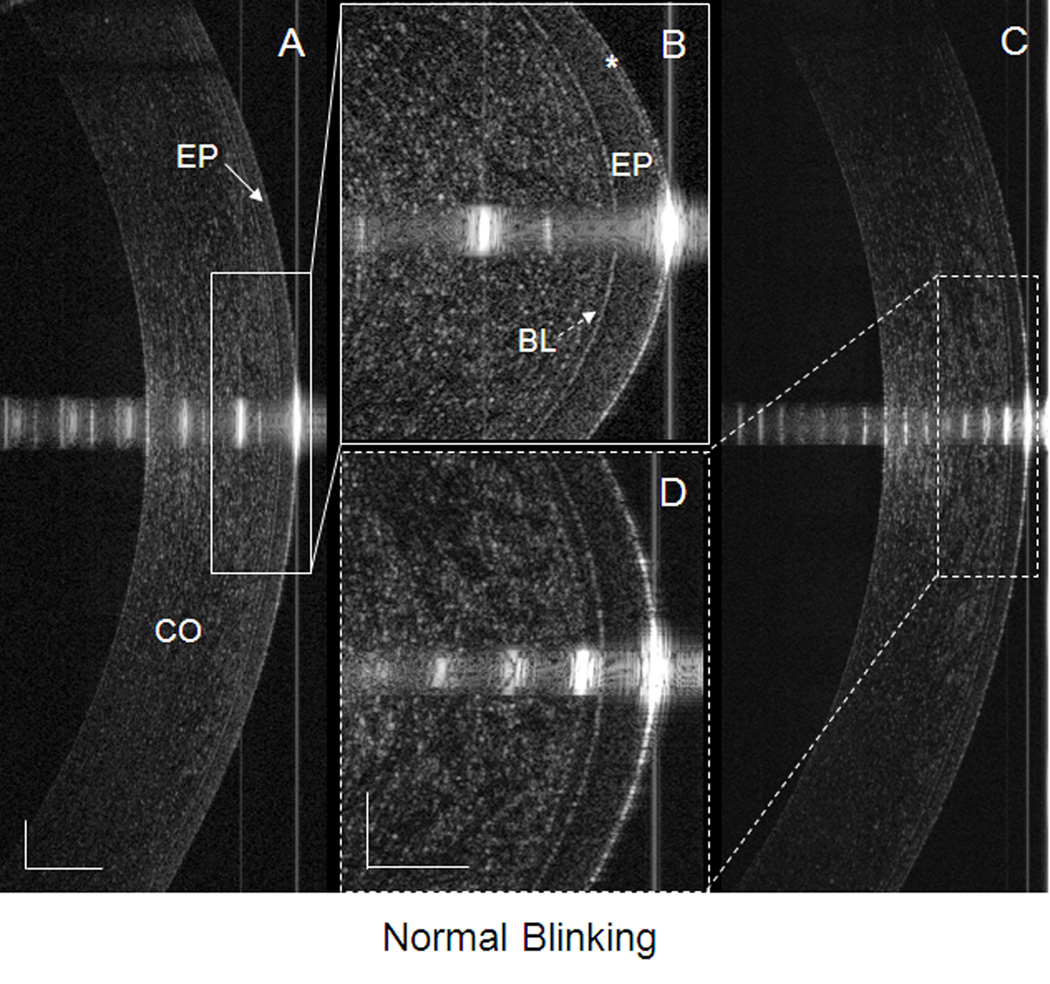
Figure 2. PCTF after a normal blink in a dry eye patient.
Images were taken by UHR-OCT at the center of the cornea immediately after a blink. (A) The PCTF was visualized and (B) can be readily observed (asterisk). The thickness of the visualized PCTF was 5.8 µm. (C) The PCTF was not visualized, even after enlargement of the image (D). CO, cornea; EP, epithelium of the cornea (solid arrow in A); BL, Bowman’s layer of the cornea (dotted arrow in B). The bars denote 250 µm for two of the images (A and C) and 100 µm for the other two images (B and D).

