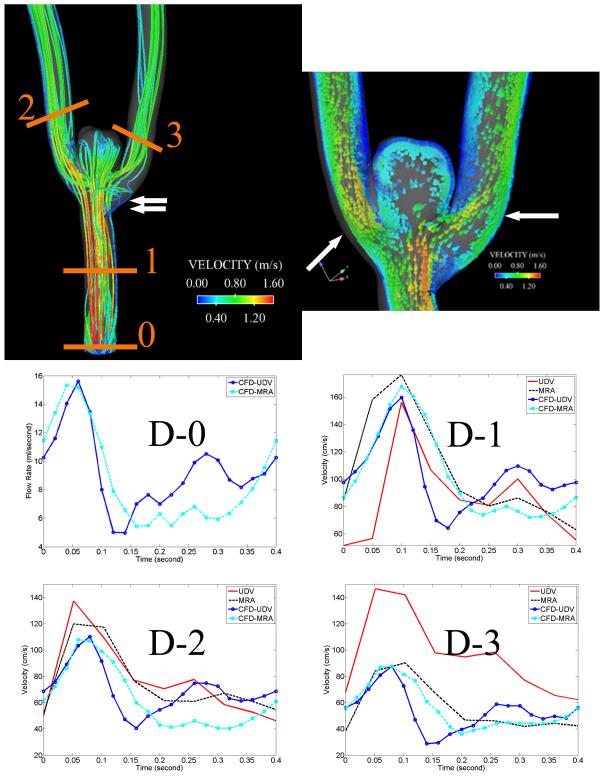
Figure 4.
An image showing streamlines (i.e. lines of tangent to instantaneous velocity vectors) of CFD simulated velocity vectors at peak systole in Subject D is displayed in the top left, while a three-dimensional velocity vector plot at a cutting plane of the same subject is shown in the top right. The input flow rate waveforms prescribed at the inlet (D-0) are shown in the middle left. The rest graphs in the bottom two rows illustrate CFD-simulated velocity waveforms (dashed cyan [MRA] and solid blue [UD] lines), UD-measured (solid red line), and MRA-measured (dashed black line) velocity waveforms at three different cross-sectional planes (D-1, D-2 and D-3) of this subject. The CFD-simulated velocities from which streamlines were derived were based on UD flow rates. The inclined and horizontal arrows in the 3D velocity vector plot (top right) point to velocity jets nearly the measurement sections D-2 and D-3, respectively. The double arrows in the streamline plot (top left) point to the disturbed low velocity region proximal to D-3.

