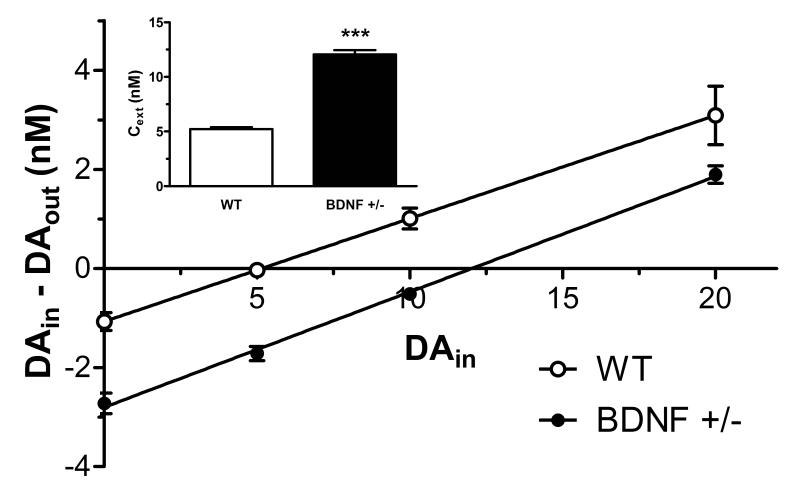
Figure 1.
Linear regression analysis of dopamine (DA) levels in the CPu of wildtype (WT) and BDNF+/− mice determined by zero net flux. The x-intercept (point of zero net flux) represents an estimate of basal extracellular DA levels (DAext). Inset shows the mean ± SEM of apparent DAext (n = 6/group). ***p < 0.001 compared to WT mice (Student’s t-test).

